Thursday, May 27, 2010

Lab #7

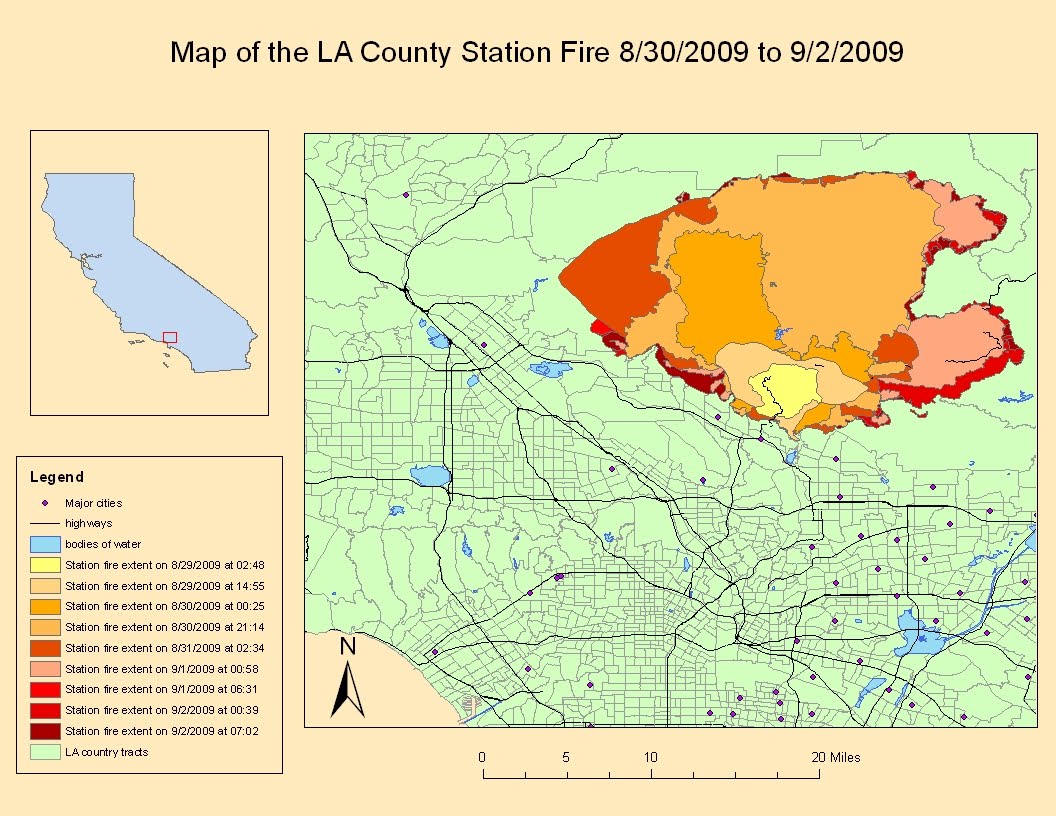
Reference map of the LA County Station fire

Thematic map of the LA County Station Fire and its proximity to nearby cities and schools

Some of the schools in the Los Angeles Unified School District were affected in the Station Fire in 2009 in a number of ways. One of the schools burned down, some of the schools were closed, some pushed back the first day of school, some were used as evacuation centers, and for some the fires interrupted sports summer practice. The thematic map I made illustrates the number of schools nearby the Station Fire.

The Los Angeles County Station Fire started in the southern portion of the Angeles National Forest and is one of the largest fires in L.A. county's modern history. The fire burned from August 26, 2009 until October 16, 2009 and burned 160,577 acres
during that time (InciWeb). The reference map I made shows the area that was burned and the thematic map I made shows the burn area, the cities nearby, and illustrates the schools nearby.

During the almost two month fire, residents that live near the effected area had to evacuate. My map shows the cities in closest proximity to the fire during August 29, 2009 to September 2, 2009 which are La Crescenta and La Canada- Flintridge, and on later dates evacuations were also made in Glendale and Altadena, as well as other cities (ABC news). Knowing what cities were affected was important because it helped identify the area of which schools were affected.

The fire started while children were still on summer break, so most children were unaffected by the fire, however the schools themselves were still in harm's way. One school was burned down in during the fire, called Gateway school which was located near the Angeles National Forest, and the La Canada Unified School District pushed back the first day of school until the fire was contained and the air quality was suitable for the schools to be reopened (LAist).

Most of the schools were being used as evacuation centers for the evacuees at La Canada High School, Jackson Elementary School in Altadena and other schools in the area (Daily News). Schools in the Acton-Agua Dulce Unified, La Canada Unified, and Glendale Unified were closed because of the fire. Schools in the Pasadena, Sunland and San Fernando Valley Unified School Districts were on summer break during the time of the fire, but all sports summer practices were canceled due to air quality (LATimesblogs).

"Station Fire Forces More Evacuations." Abc30. 29 Aug. 2009. Web. 26 May 2010. http://abclocal.go.com/kfsn/story?section=news/local/los_angeles&id=6989236

"InciWeb the Incident Information System: Station Fire News Release." InciWeb the Incident Information System: Current Incidents. Web. 26 May 2010. http://inciweb.org/incident/article/9640/

"Schools Remain Closed Because of Station Fire | L.A. NOW | Los Angeles Times." Los Angles Times. 1 Sept. 2009. Web. 8 June 2010. http://latimesblogs.latimes.com/lanow/2009/09/schools-remain-closed-because-of-station-fire.html


"Station Fire Update: Evacuations, School Closures & Other Info - LAist." LAist: Los Angeles News, Food, Arts & Events. 30 Aug. 2009. Web. 26 May 2010.
http://laist.com/2009/08/30/station_fire_update.php


"Wildfire Rages within Whisker of San Fernando Valley - LA Daily News." Home - LA Daily News. 30 Aug. 2009. Web. 8 June 2010. http://www.dailynews.com/news/ci_13230693


Thursday, May 20, 2010

Lab #6


This is my map of a south east part of Louisiana. This map shows end of some mountains with rivers flowing from them. The mountains are not particularly tall, their slope doesn't vary too dramatically. The land next to the rivers is low and I believe it looks like a delta, which is appropriate in the area because if the map showed the area south of it, the Gulf of Mexico would be seen.

The extent information is:
top: 30.8128
left: -91.3355
right: -90.5922
bottom: 30.3472
Geographic coordinate system: ?


Thursday, May 13, 2010

Lab#5


Distance from Washington D.C., USA to Kabul, Afghanistan (in miles):
World Cylindrical projection: 10,099.35 miles
Mollweide projection: 10,155.94 miles
Equidistant Conic projection: 7,927.93 miles
Equidistant Cylindrical projection: 7,003.47 miles
Mercator projection: 10,160.03 miles
Gall Stereographic projection: 7,141.80 miles


Map projections are inevitable in the process of map making. Different projections allow maps to be represented on different planes. All map projections are distorted in some way, but depending on what they are being used for, some distortions are acceptable because they do not interfere with the information being collected, while using the same map for a different reason may make that map unacceptable.

Maps are made to preserve one or more of the following properties: shape, area, bearing, distance, scale, and direction. No map can preserve all of these properties, which is why many different projections are useful.

Different types of projections preserve different types of data. Conformal projections preserve local distance, Equidistant preserves distance, Equal Area preserves area. These projections vary in uses displaying different types of information accurately. One would have to research what type of information they want preserved and use the appropriate map to avoid incorrect information and discrepancies.

An example of discrepancies between maps can be shown by the differences in the distance of Washington D.C. and Kabul in the map projections. They vary from lengths as far as 3,000 miles in some comparisons.

Thursday, May 6, 2010

Lab #4


GIS has a lot of potential because of the need for spatial data. GIS manages and manipulates spatial data that merges cartography and database technology. It has enhanced the efficiency and analytical aspect of maps. GIS is used for urban planning, land surveying, navigation, and the like. This means that the earth is much better understood than before.

GIS allows land surfaces to be quantified, such as how much tropical rain forest or wetlands are in certain areas. It can also keep track of temperature, rainfall, and fire in these areas. GIS is used to recognize spatial relationships like what contains what and how close is that to that. Geocoding is also very useful by giving an x,y coordinate to street addresses, zip codes, etc. GIS is also good at representing change over time. This is useful in predicting global climate change, growing seasons of vegetation, geological processes, and human activities related to land management.

Some pitfalls of GIS is that it can be hard to use/ heard to learn how to use. Also GIS programs are expensive. The software and hardware needed to use GIS systems can often be hard to get because of this.

GIS is and can be very helpful, however the ArcGIS program is not my friend. It took me an embarrassing amount of time to finish this lab. The directions were precise and easy to follow, but it all being new, required a lot of back and forth with the program and tutorial. Saving everything in the proper place was a lot harder than I thought. I thought that when I saved it on my F: drive that everything was on there but it wasn't so I lost a lot of my charts. Zooming in and out completely shifted the map around which set me back a few minutes several times. I haven't been so frustrated in a while, learning this new technology is a lot harder than I expected. None of it was especially difficult so I don't know why I took so long, but taking so long made me feel sad at myself.